
25 Jan
2013
25 Jan
'13
1:38 p.m.
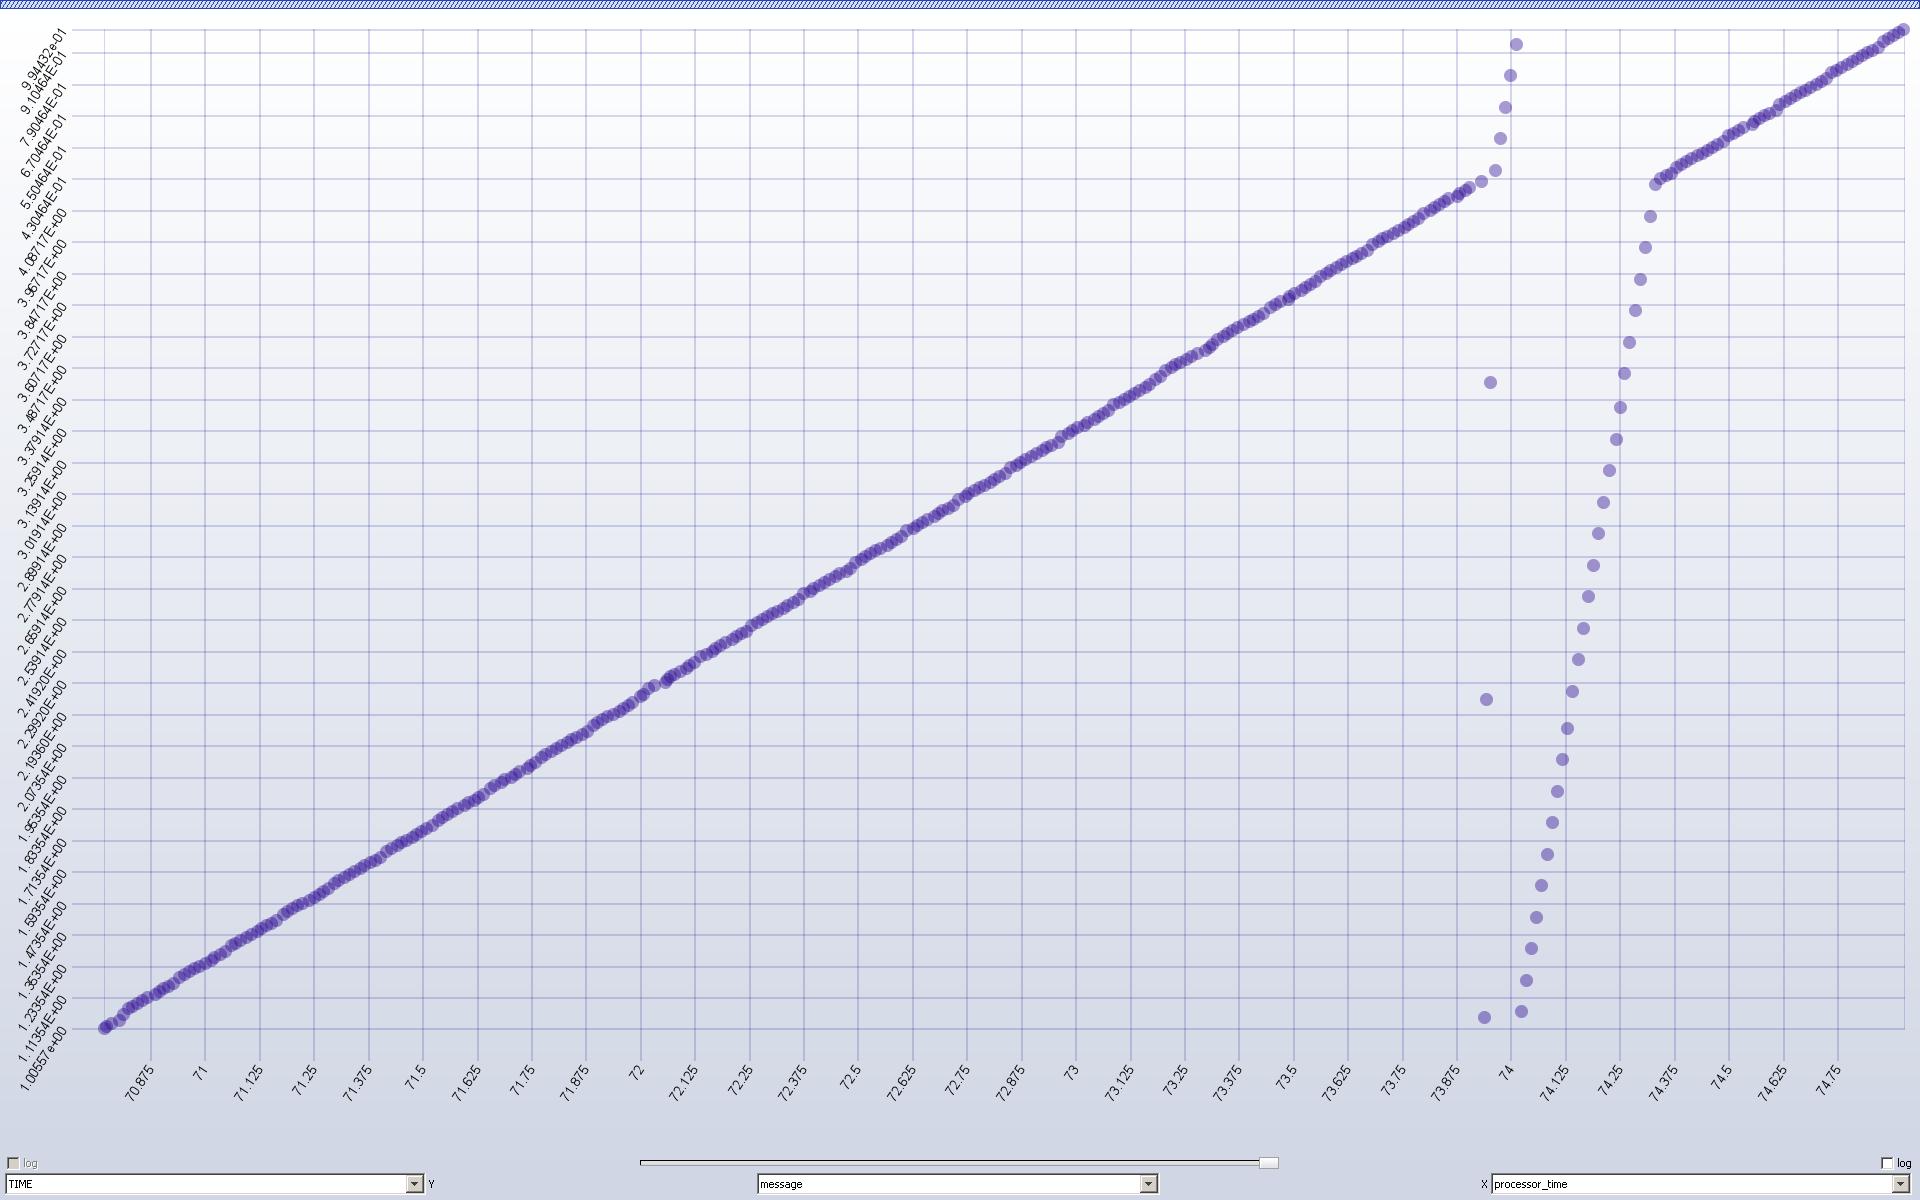
Hi I find BaseX a very powerful tool. One thing I noticed however is that it misunderstands numbers in scientific notation in the scatter plot display. Please see the attached plot. The samples should form a rough diagonal line. However, look at the scale on the left and you can see the exponent field is 'dis-continuous'. It looks like the chart formatter treats it as a non-scientific number or possibly even lexicographic order. Best Regards Greg